
Monitoring RPE Maturation Trajectories With AI-Guided Live-Cell Image Analytics
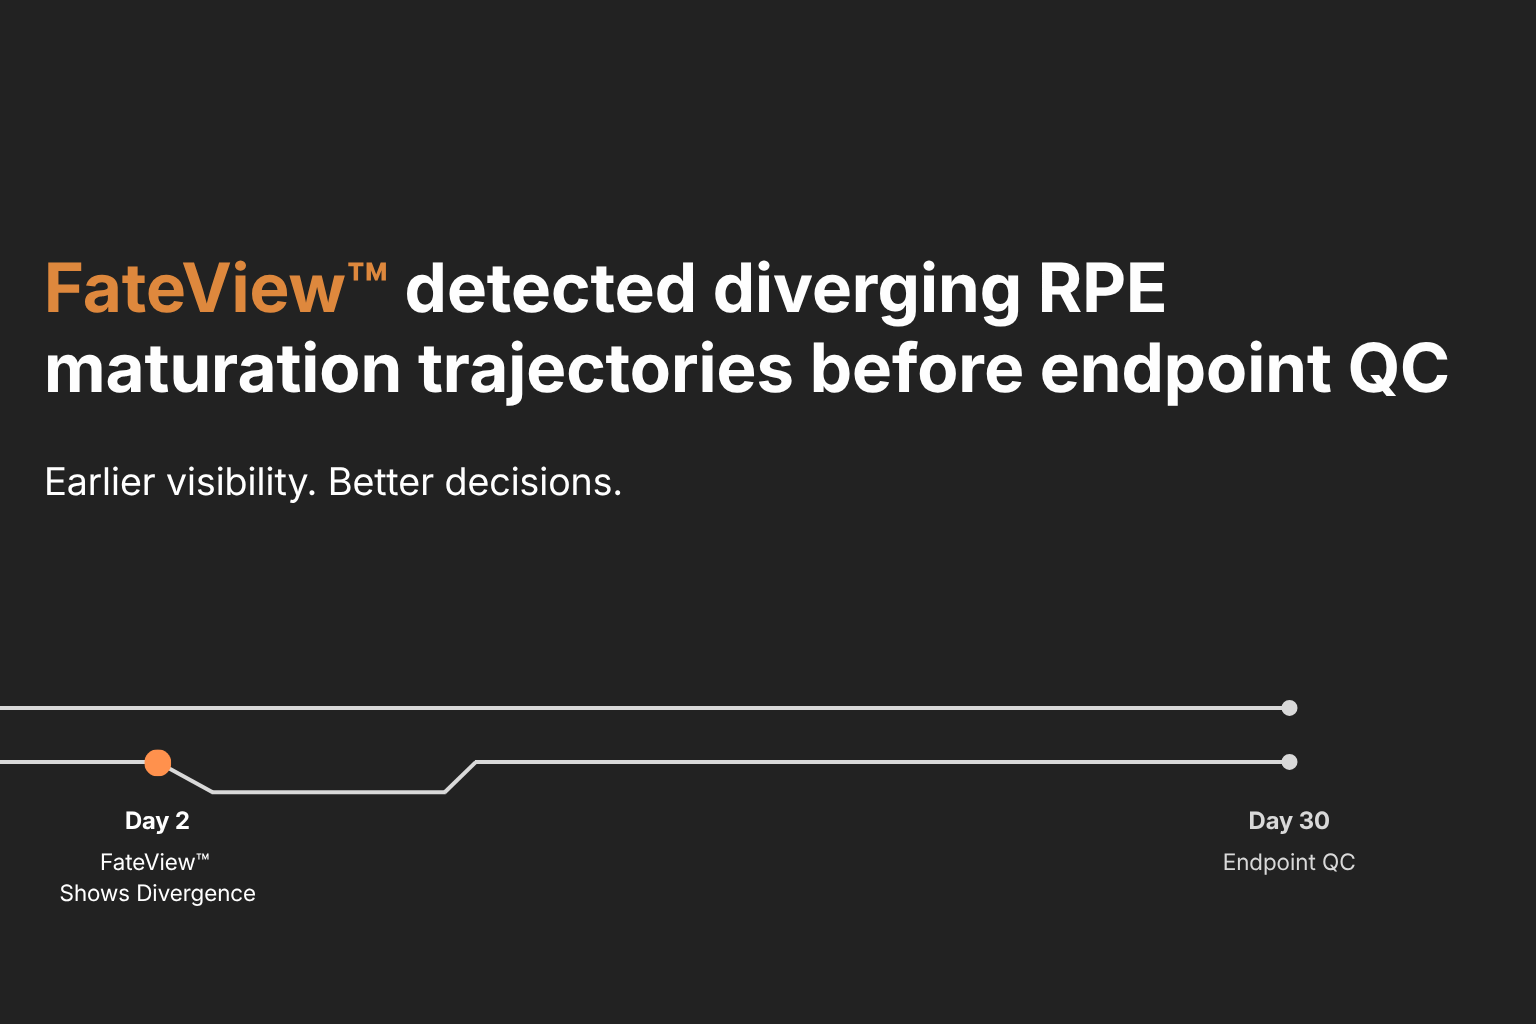
Maturation of stem cell-derived retinal pigment epithelial (RPE) cells is a lengthy, resource-intensive, and often unpredictable process. Variability across cell lines, batches, operators, and culture conditions can influence the quality of RPE cells produced. It can also be difficult to objectively identify when maturation is off-track. As a result, teams may spend weeks maintaining cultures without realising they have already diverged. By the time endpoint assays reveal the issue, it is too late to correct the trajectory.
To address these challenges, quantitative monitoring over time is needed to assess whether cultures are progressing as expected, compare culture conditions consistently, and detect early divergence from the expected maturation path.
In this internal study, FateView™ was used to analyse longitudinal live-cell images and detect early maturation patterns from single-cell morphological features. The platform provided non-destructive, quantitative insight into culture development, enabling continuous assessment of maturation without consuming precious sample material. The overall 30-day workflow is summarised in Figure 1.
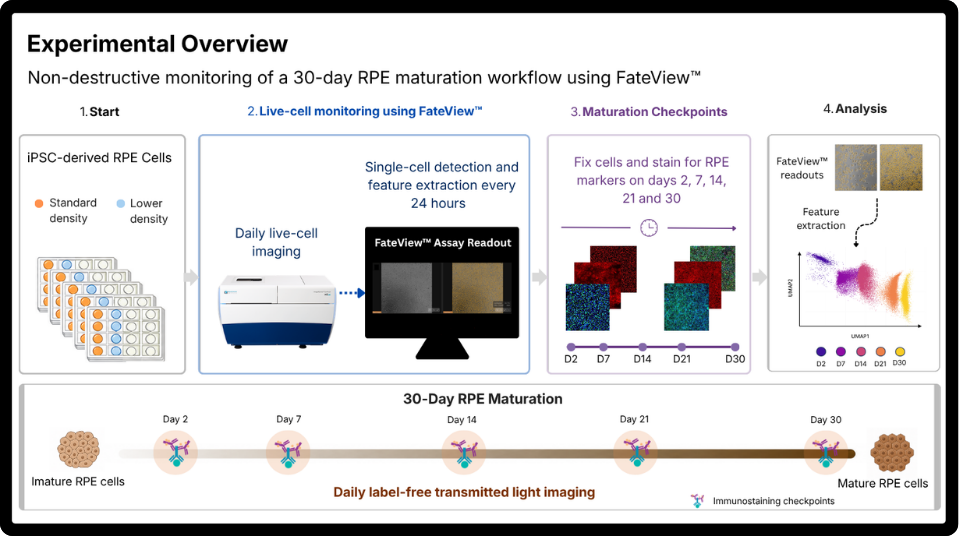
Figure 1: Experimental overview of the 30-day RPE maturation workflow. RPE cultures were monitored daily using label-free transmitted light imaging, with immunostaining performed at defined maturation checkpoints. FateView™ was used to extract live-cell image features and analyse maturation-associated changes across seeding density conditions.
Monitoring RPE Maturation using FateView™
RPE cells were matured over 30 days while comparing two different seeding densities. Throughout this period, label-free transmitted-light images were acquired daily and analysed using FateView™ (Figure 2) to extract and quantify image-derived features. This enabled continuous, objective, and non-destructive monitoring of maturation dynamics.
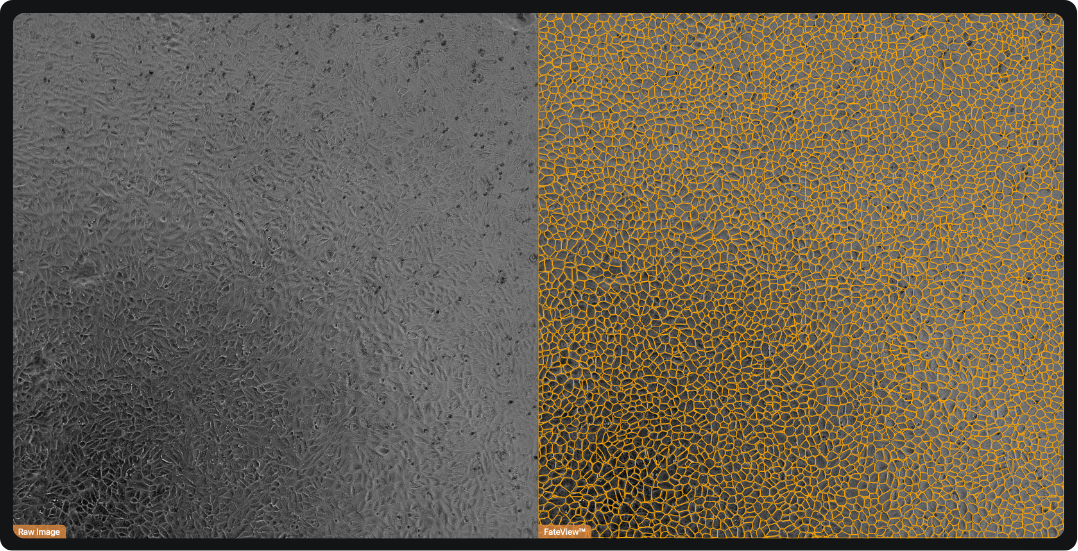
Figure 2: Single-cell detection and counting of RPE cells using FateView™.
FateView™ single-cell detection and counting performed on RPE cells 2 days post-thaw.
To assess maturation progression and validate FateView™ -derived readouts, replicate plates were fixed and immunostained on days 2, 7, 14, 21, and 30 for RPE-associated markers. These were used to assess cell identity, maturation status, and epithelial organisation (Figure 3).
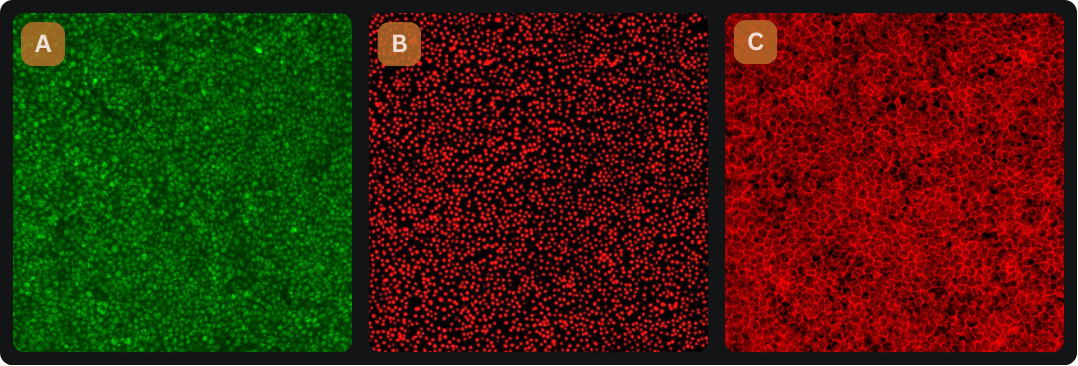
Figure 3: Representative Immunofluorescence images to support assessment of pigmentation and RPE maturation. (A) TYRP staining at day 7 marks pigmentation-associated RPE features. (B) MITF staining at day 30 is linked to RPE identity. (C) ZO-1 staining at day 30 shows epithelial organisation and tight junction formation.
FateView™ Detects Diverging RPE Maturation Trajectories
Clear differences in morphological features were detected between seeding density conditions throughout RPE maturation. When visualised as a UMAP, cells grouped according to maturation stage, with clusters showing less distinct separation in the lower seeding density. This indicated that FateView™ captured measurable maturation-associated changes across the 30-day workflow and between culture conditions (Figure 4).
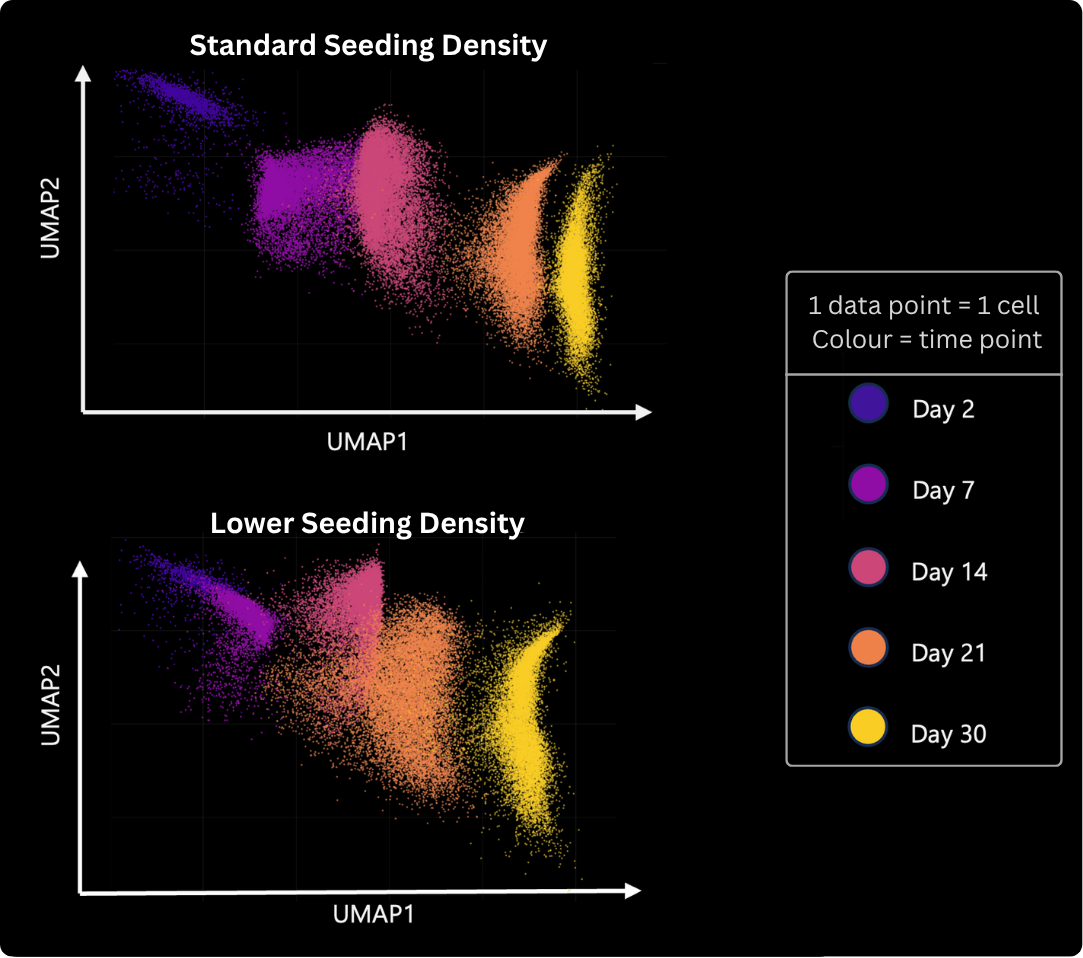
Figure 4: FateView™ label-free image analysis reveals divergent RPE maturation trajectories. FateView™ was used to extract features from live-cell images of RPE cultures seeded at standard and lower seeding densities. UMAP visualisation shows how the cultures progressed from Day 2 to Day 30, highlighting differences in maturation trajectories between the two seeding densities.
Using hexagonality as an example of a feature associated with RPE maturation, FateView™ detected divergence between the two culture conditions as early as day 2 (Figure 5A). ZO-1 immunostaining supported this observation, with differences in epithelial organisation visible at day 7, before becoming comparable by day 14 (Figure 5B-E). This suggests delayed tight junction formation in cultures seeded at the lower density. Together, these findings highlight that FateView™ detected biologically meaningful divergence in RPE maturation from label-free images during an early window not captured by endpoint staining.
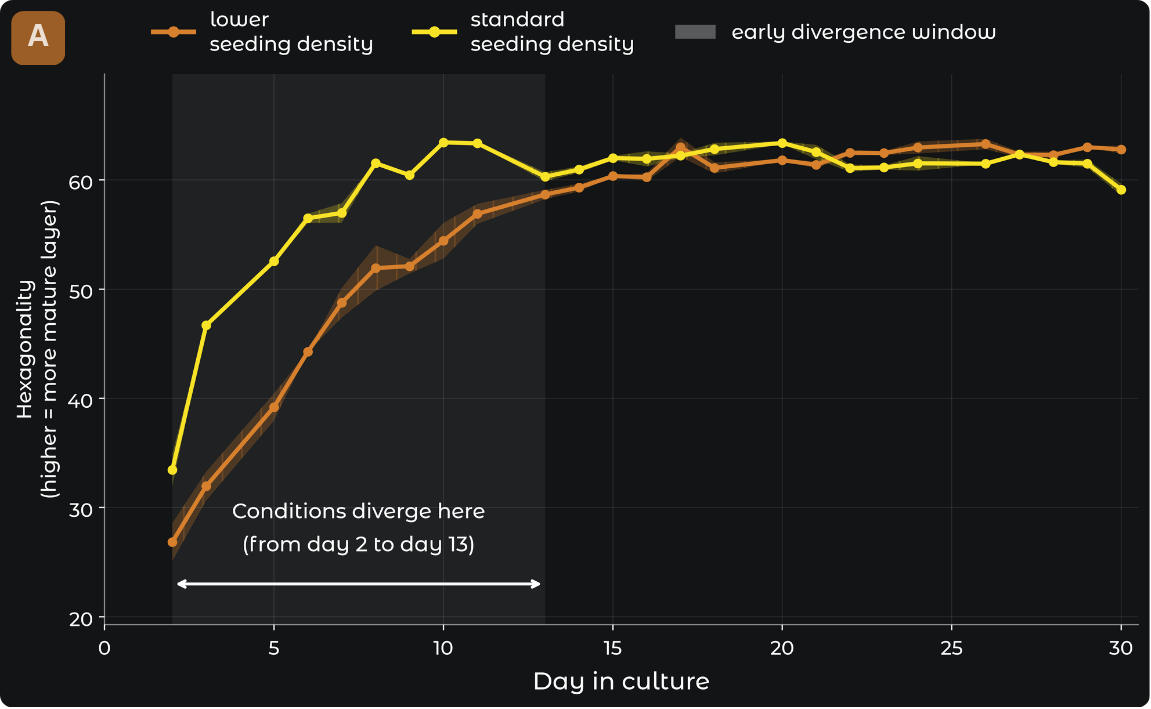
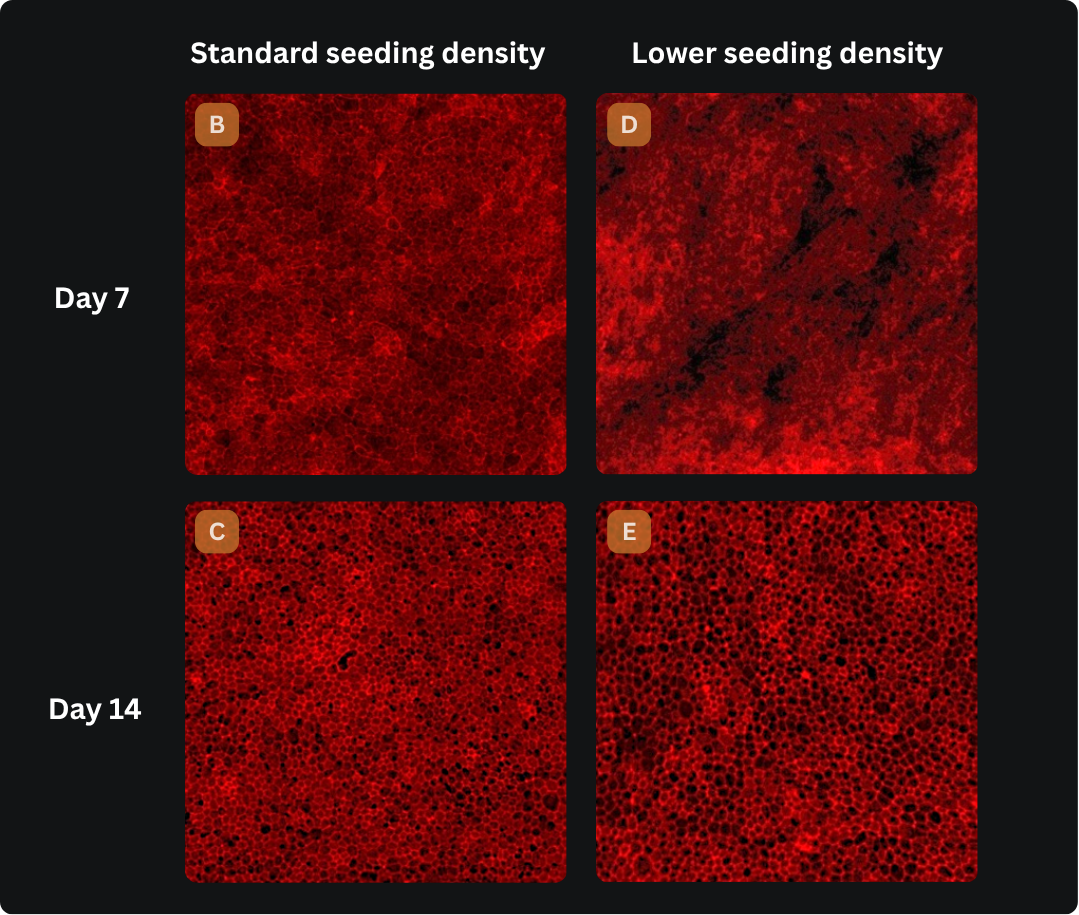
Figure 5: ZO-1 staining supports delayed epithelial organisation detected by FateView™. (A) FateView™-derived hexagonality readout, which shows divergence from around Day 2. (B-E) ZO-1 immunostaining of standard and lower seeding density conditions at days 7 and 14. Lower-density cultures show less defined epithelial organisation at day 7 before becoming more comparable by day 14.
Broader Applications
Although this study specifically focused on RPE maturation, this approach may be relevant to a wide range of other live-cell and differentiation workflows, where cell morphologies or states change over time, and where endpoint assays are destructive, delayed, or costly.
By extracting quantitative features from label-free images, FateView™ can support non-destructive analysis at individual timepoints or longitudinally, across extended culture workflows. This ability to track live-cell changes over time can help teams identify divergence patterns earlier, compare cell culture conditions more consistently, and make informed decisions before endpoint assays are available.
The same framework can also be tailored to recognise image-derived features associated with different cell types, phenotypes, and biological processes.
Learn more about FateView™ and custom assays for specific workflows and experimental readouts.